
In the Fall 2024 semester, we are meeting on Wednesdays 1 - 2 pm (Central): at UNL we will meet in 354A Hardin Hall (large conference room), at ISU we meet in TBD (ask Tom Lin), we will also meet via Zoom. Please join us for presentations on statistical graphics and computational tools.
Contact Heike Hofmann, hhofmann4 at unl.edu, for access to the Zoom link.
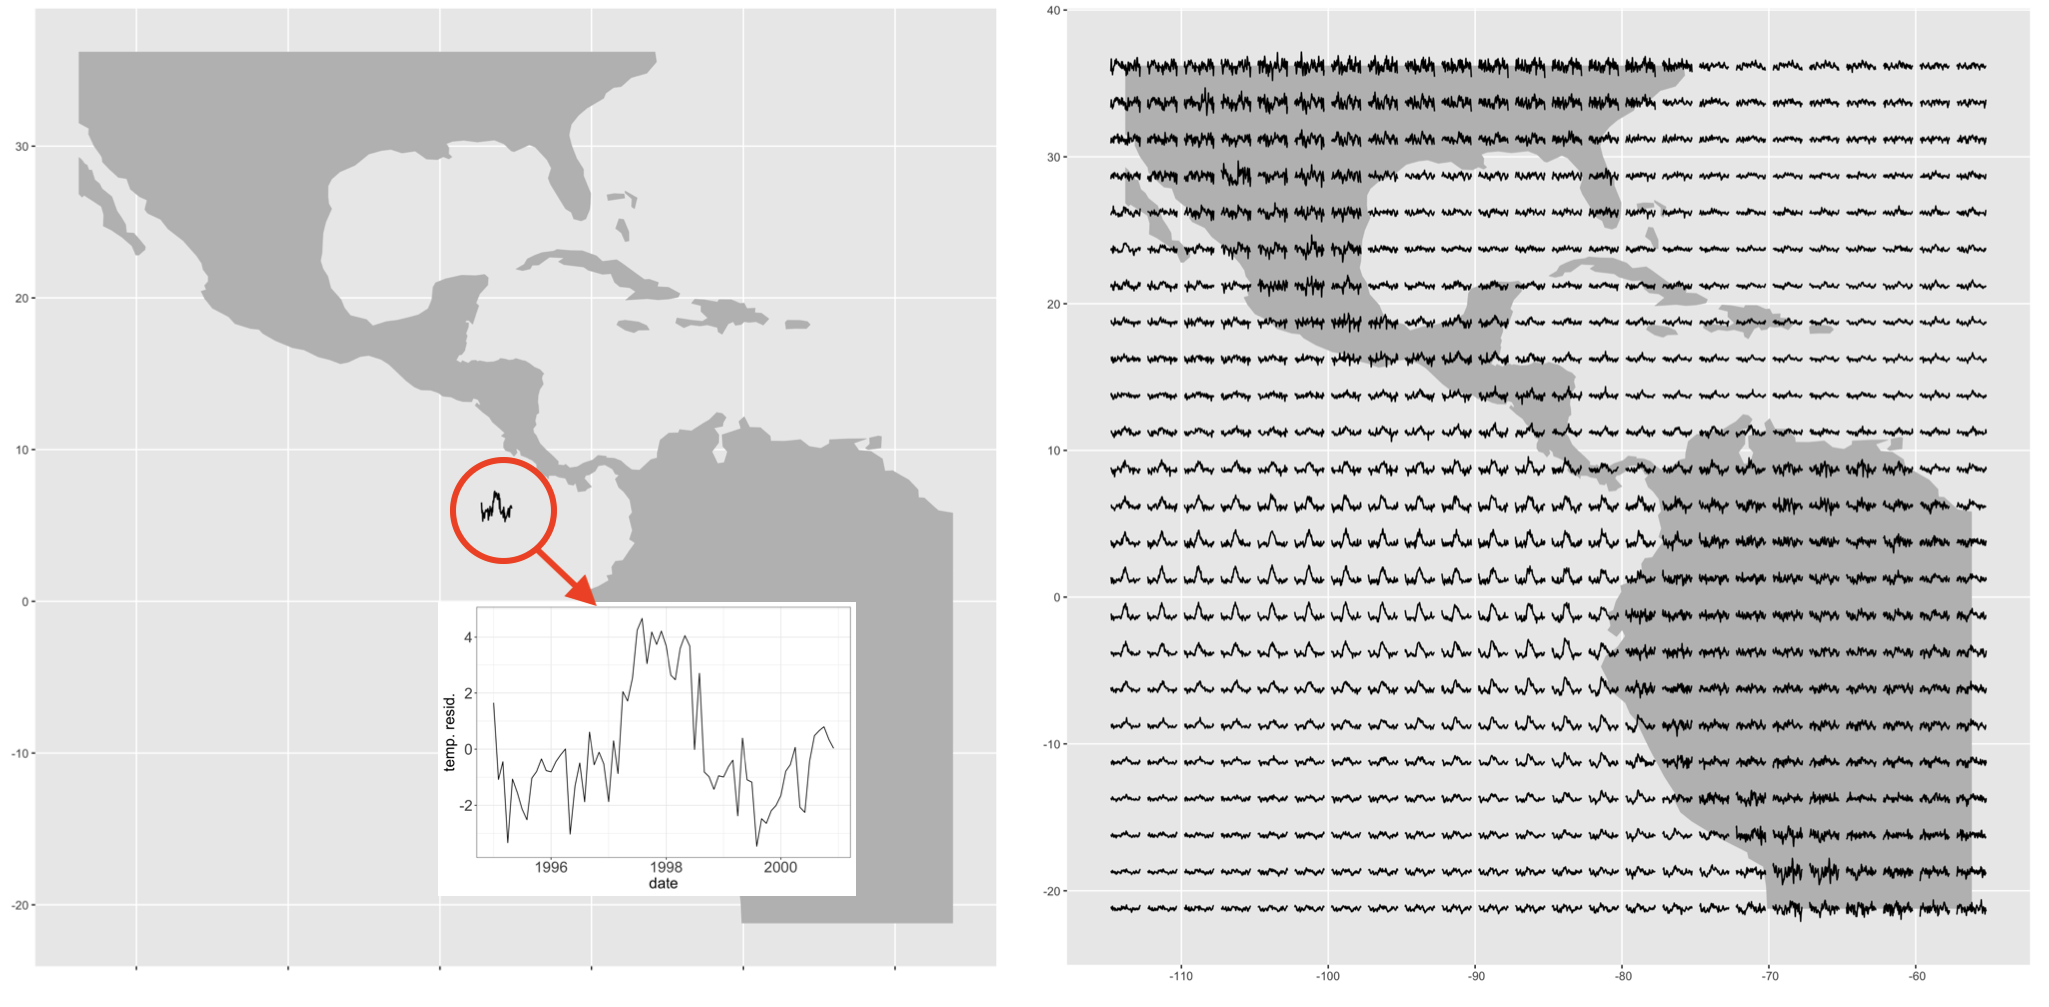
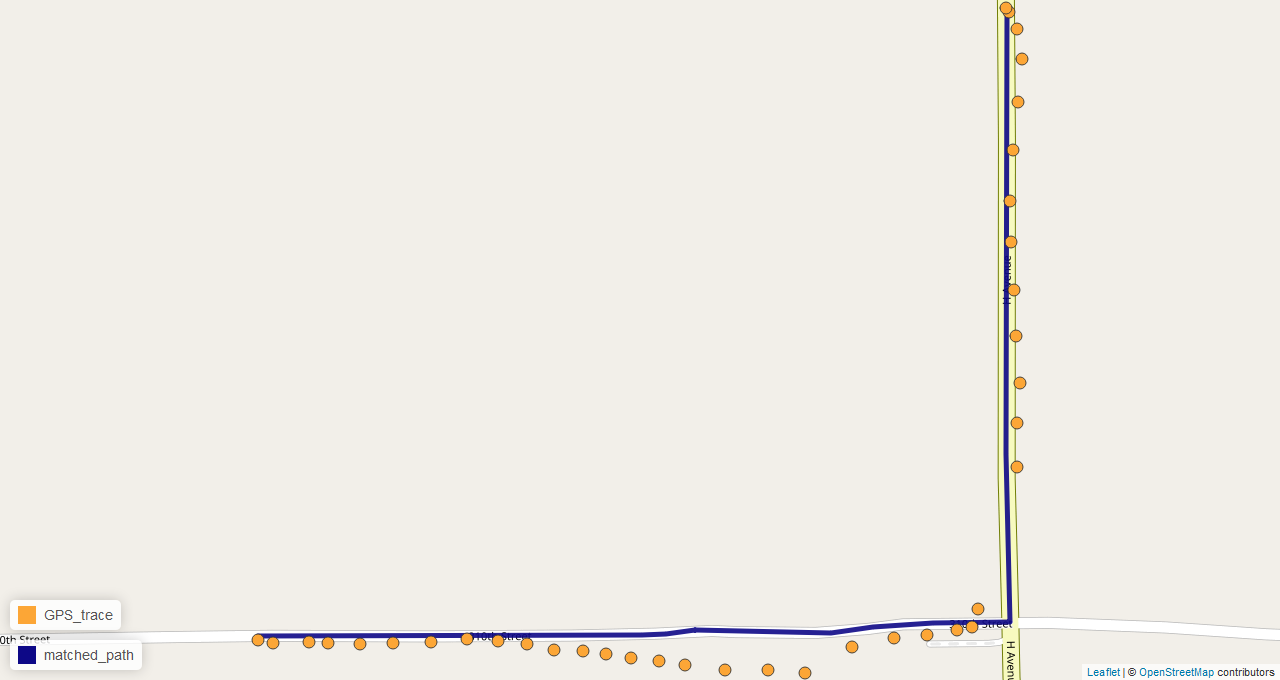
Pivoting between space and time: Spatio-temporal analysis with cubble
R Package
cubble
Visualization
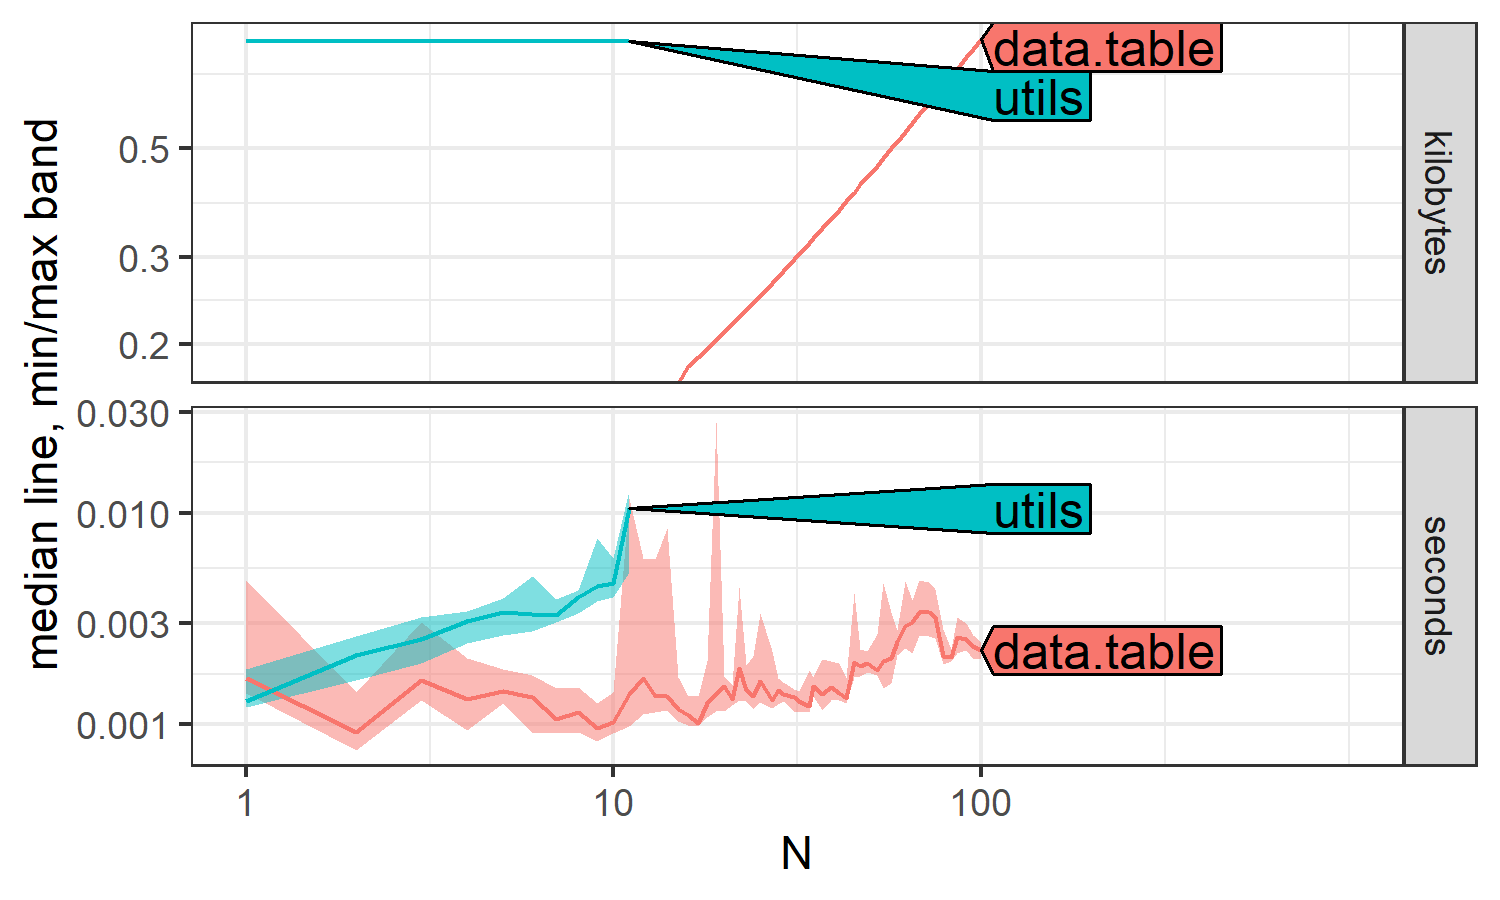
Asymptotic timing and memory analysis with the atime packages
R Package
atime
Visualization

Visualize your fitted nonlinear dimension reduction model in the high-dimensional data space
R Package
quollr
Visualization
Using and contributing to the data.table package for efficient big data analysis
R Package
data.table
big data

Creating an R Package for Courtroom Transcript Survey Interface
R Package
courtr
Courtroom Transcript Survey

Setting Up Real-Time Object Detection, Classification, Human Pose Estimation, and Open Vocabulary Object Detection In Minutes Using Ultralytics
Object Detection
Classification
Human Pose Estimation
Ultralytics
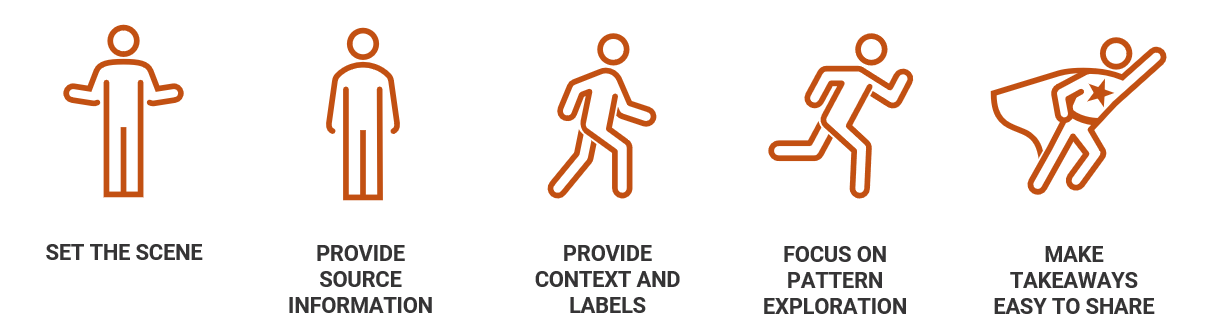
Visualizing for Impact: the role of data visualization expertise in public policy research
Data visualization
Public policy
Applied statistics
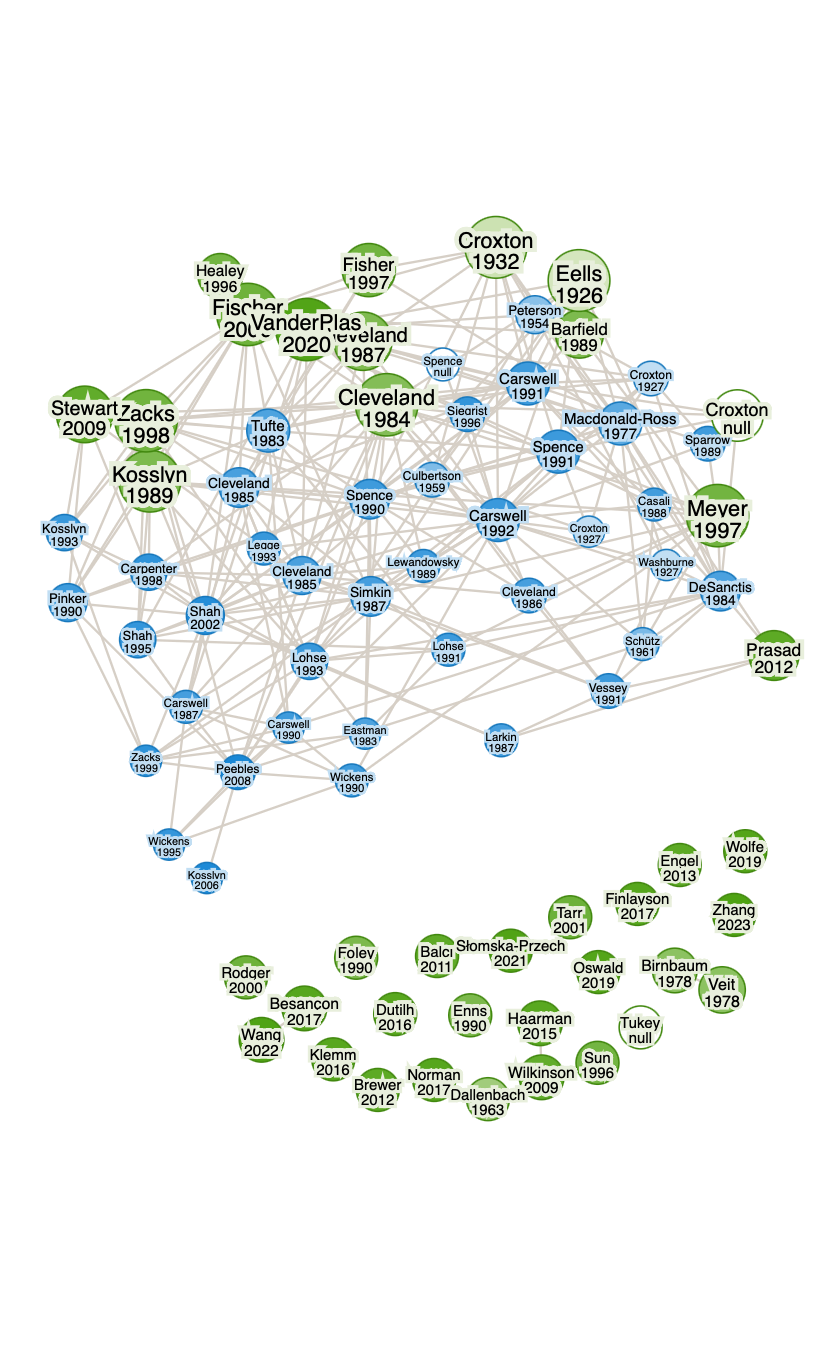
Let’s go down the rabbit hole!
Research Rabbit
Literature review
Zotero
The Alchemy of AI: Sparking Creativity with Algorithmic Magic
AI
Machine learning
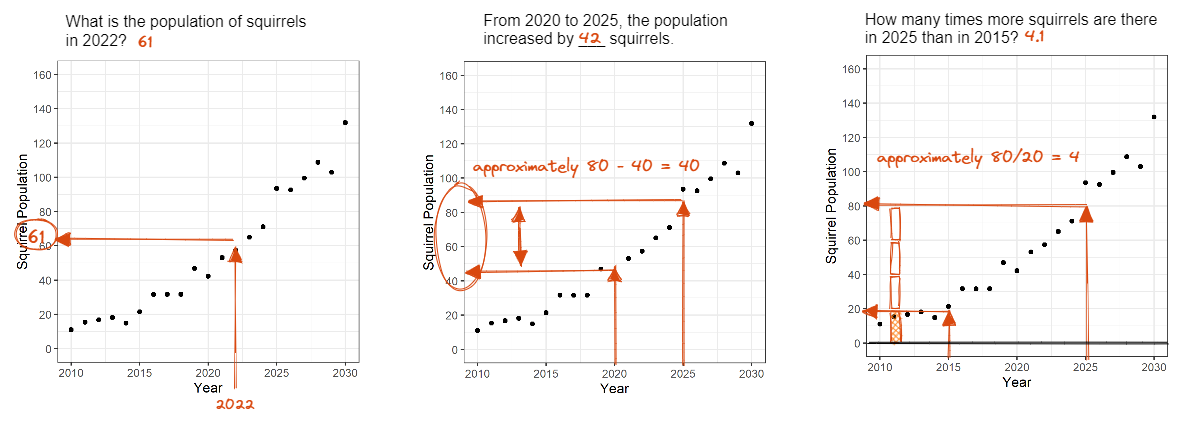
Making Visualizations to Study Probability Theory
Visualizations
Probability Theory
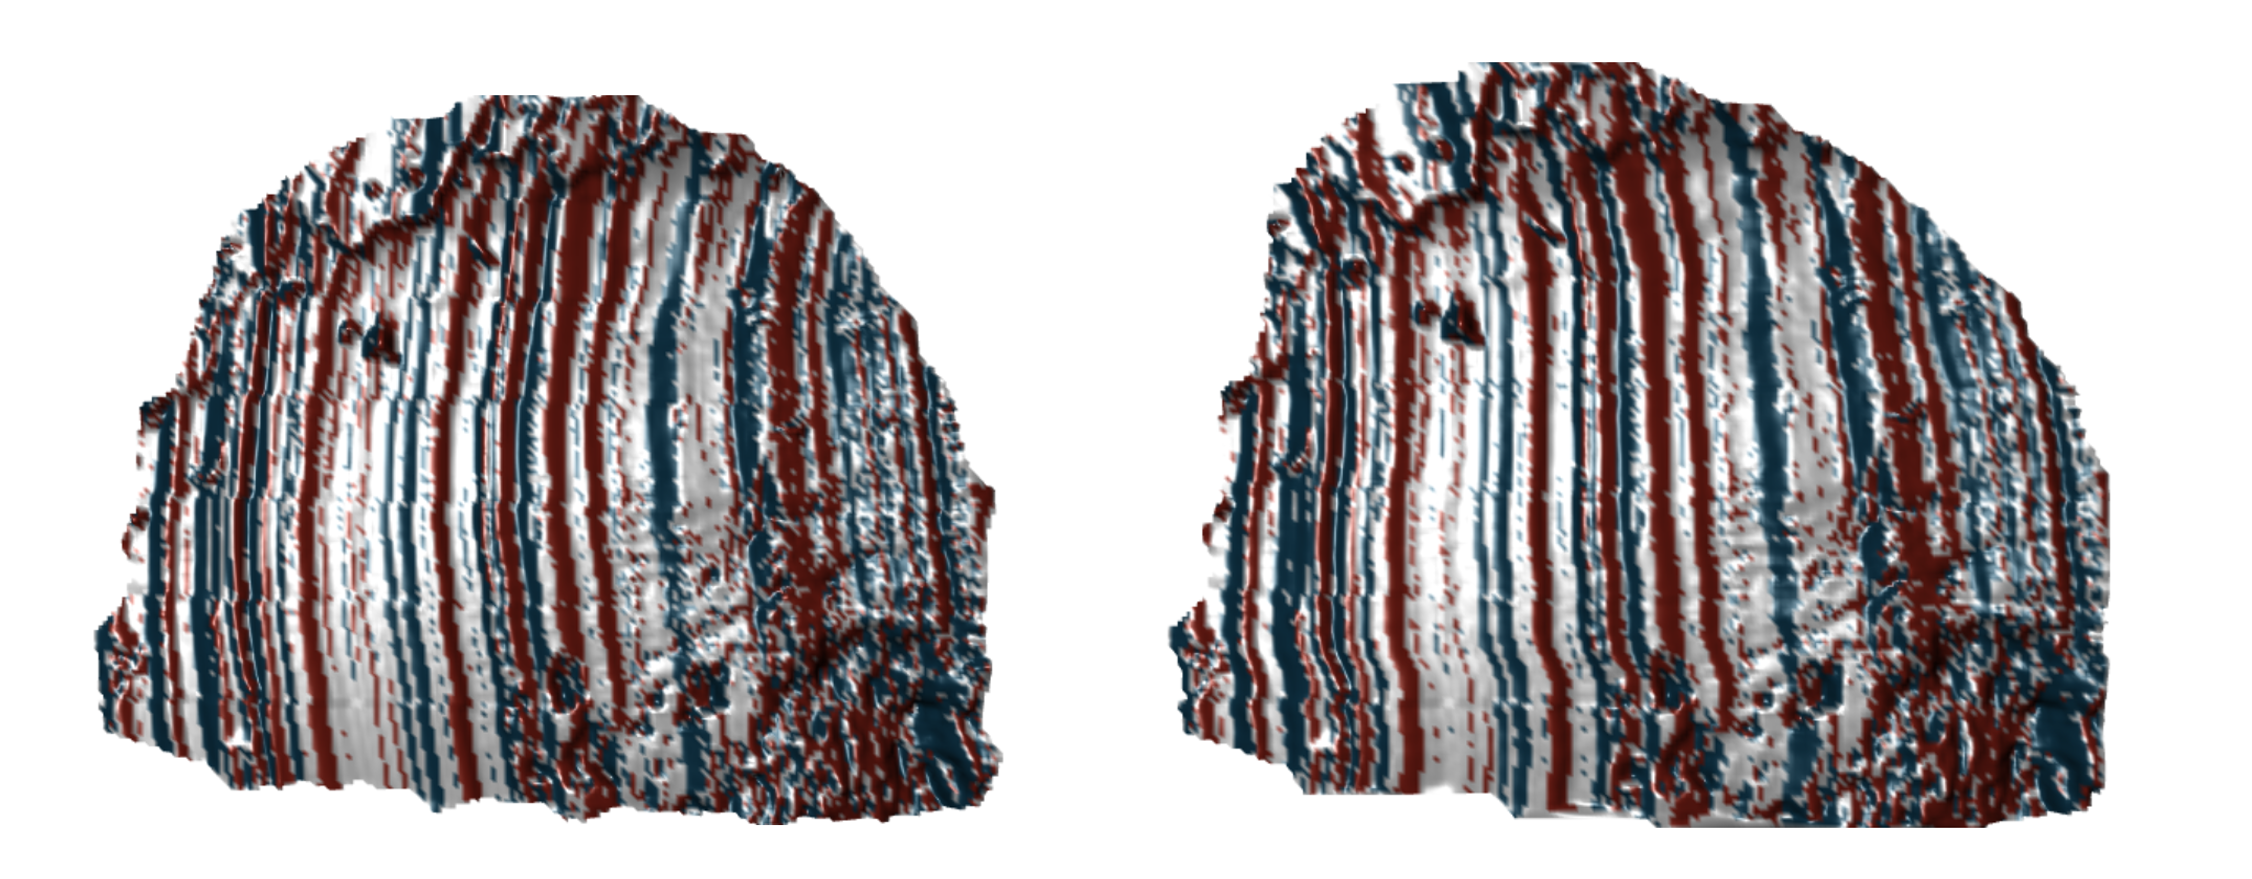
Algorithmic assessment of striation similarity between wire cuts
Forensics
Data Visualizations
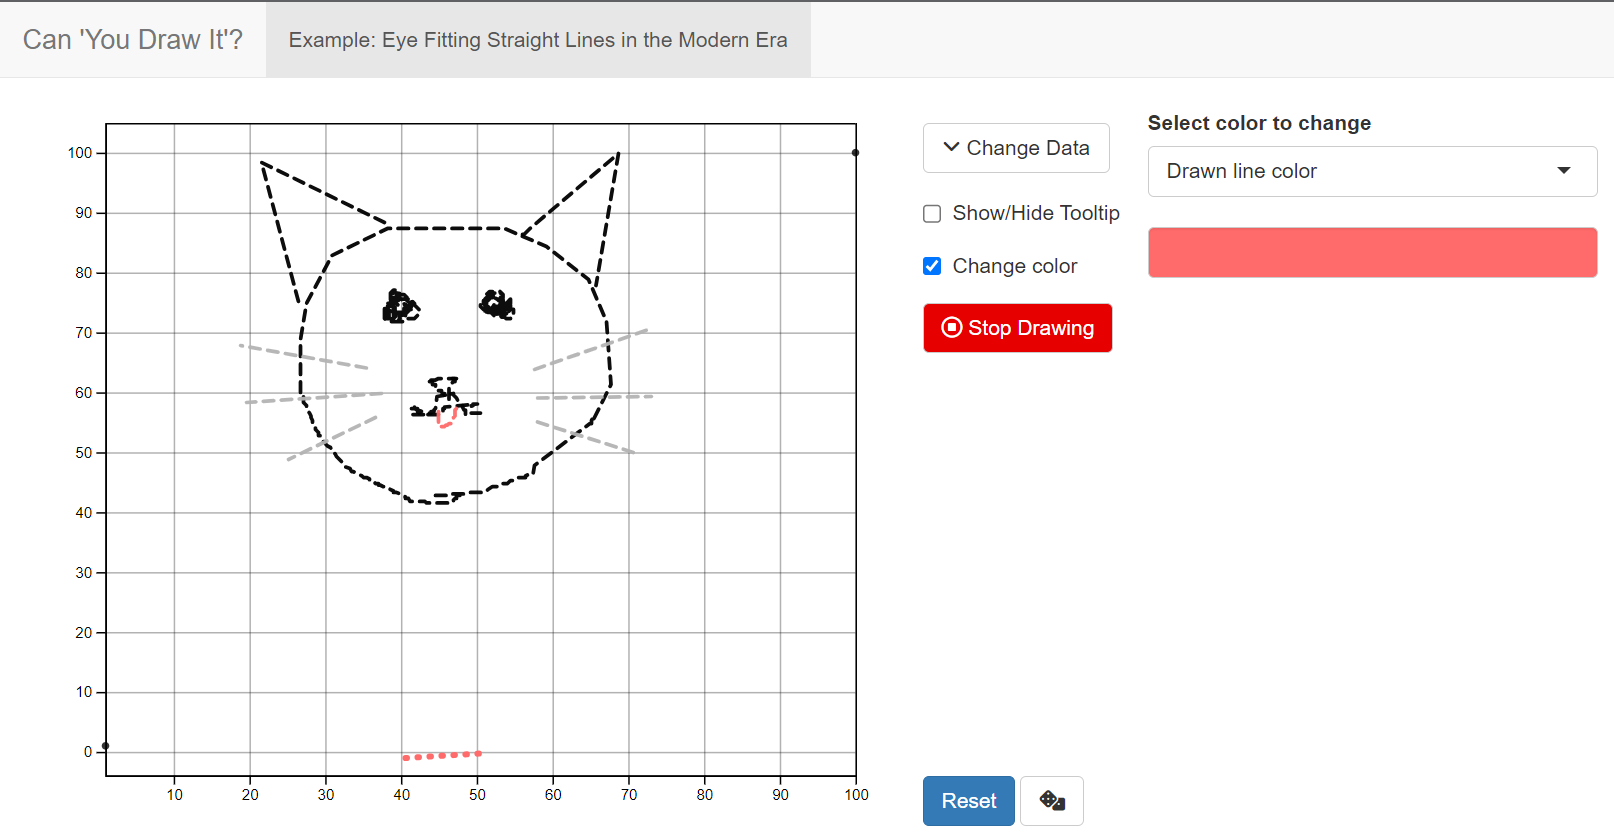
The youdrawitR package - a GSOC experience
R package
GSOC
Shiny App
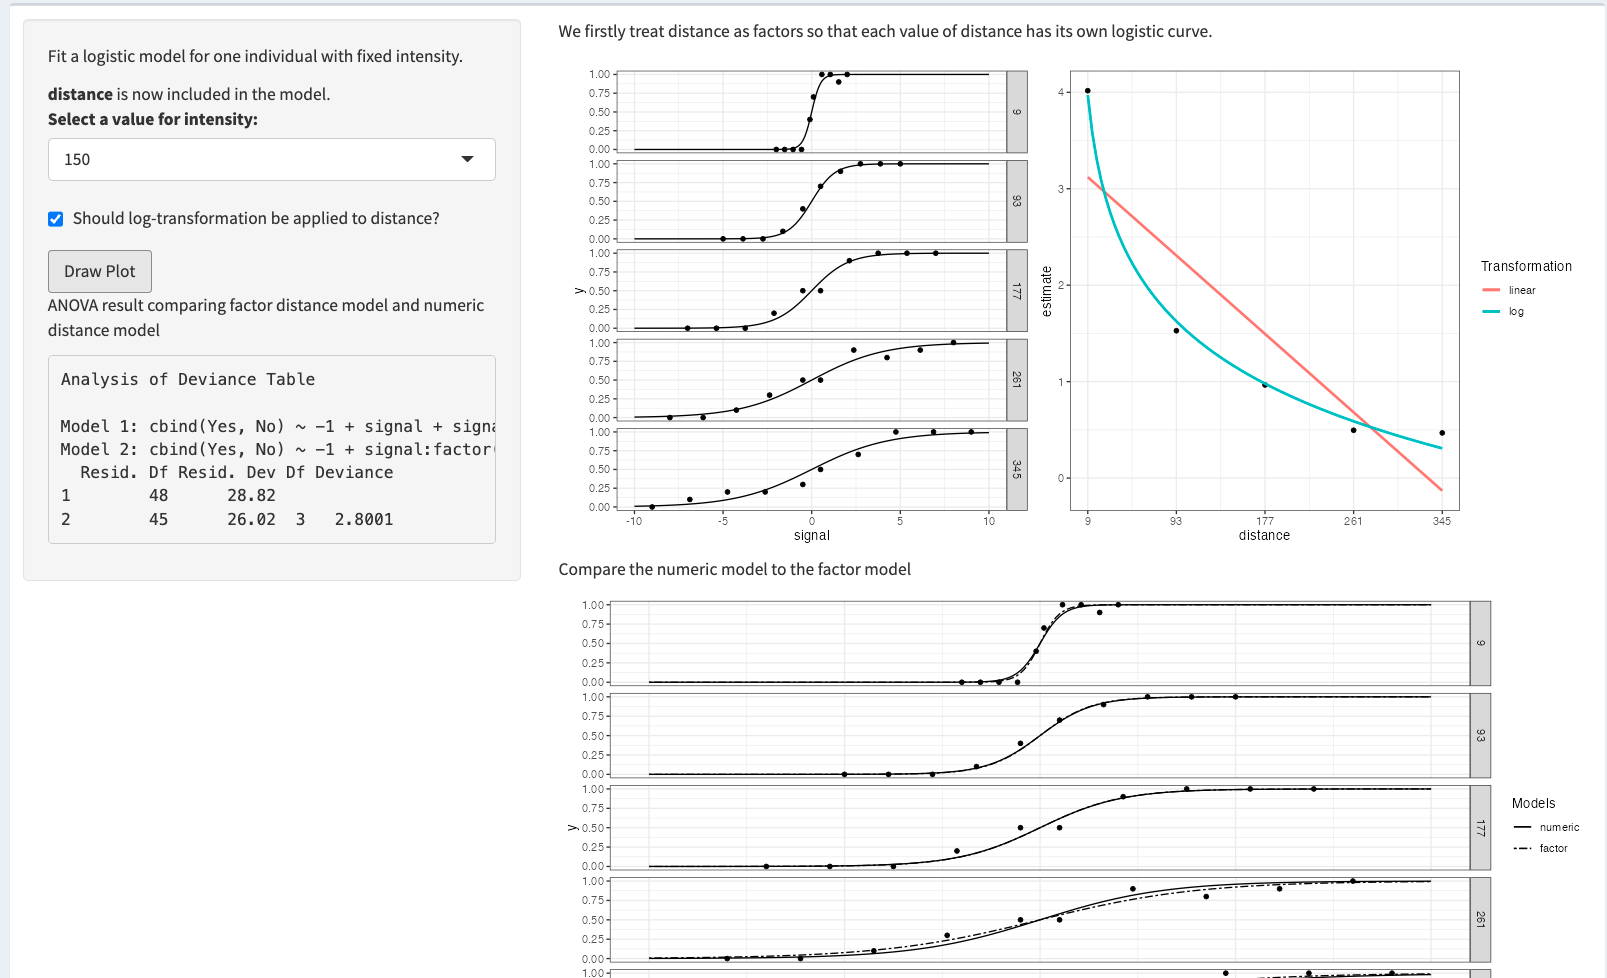
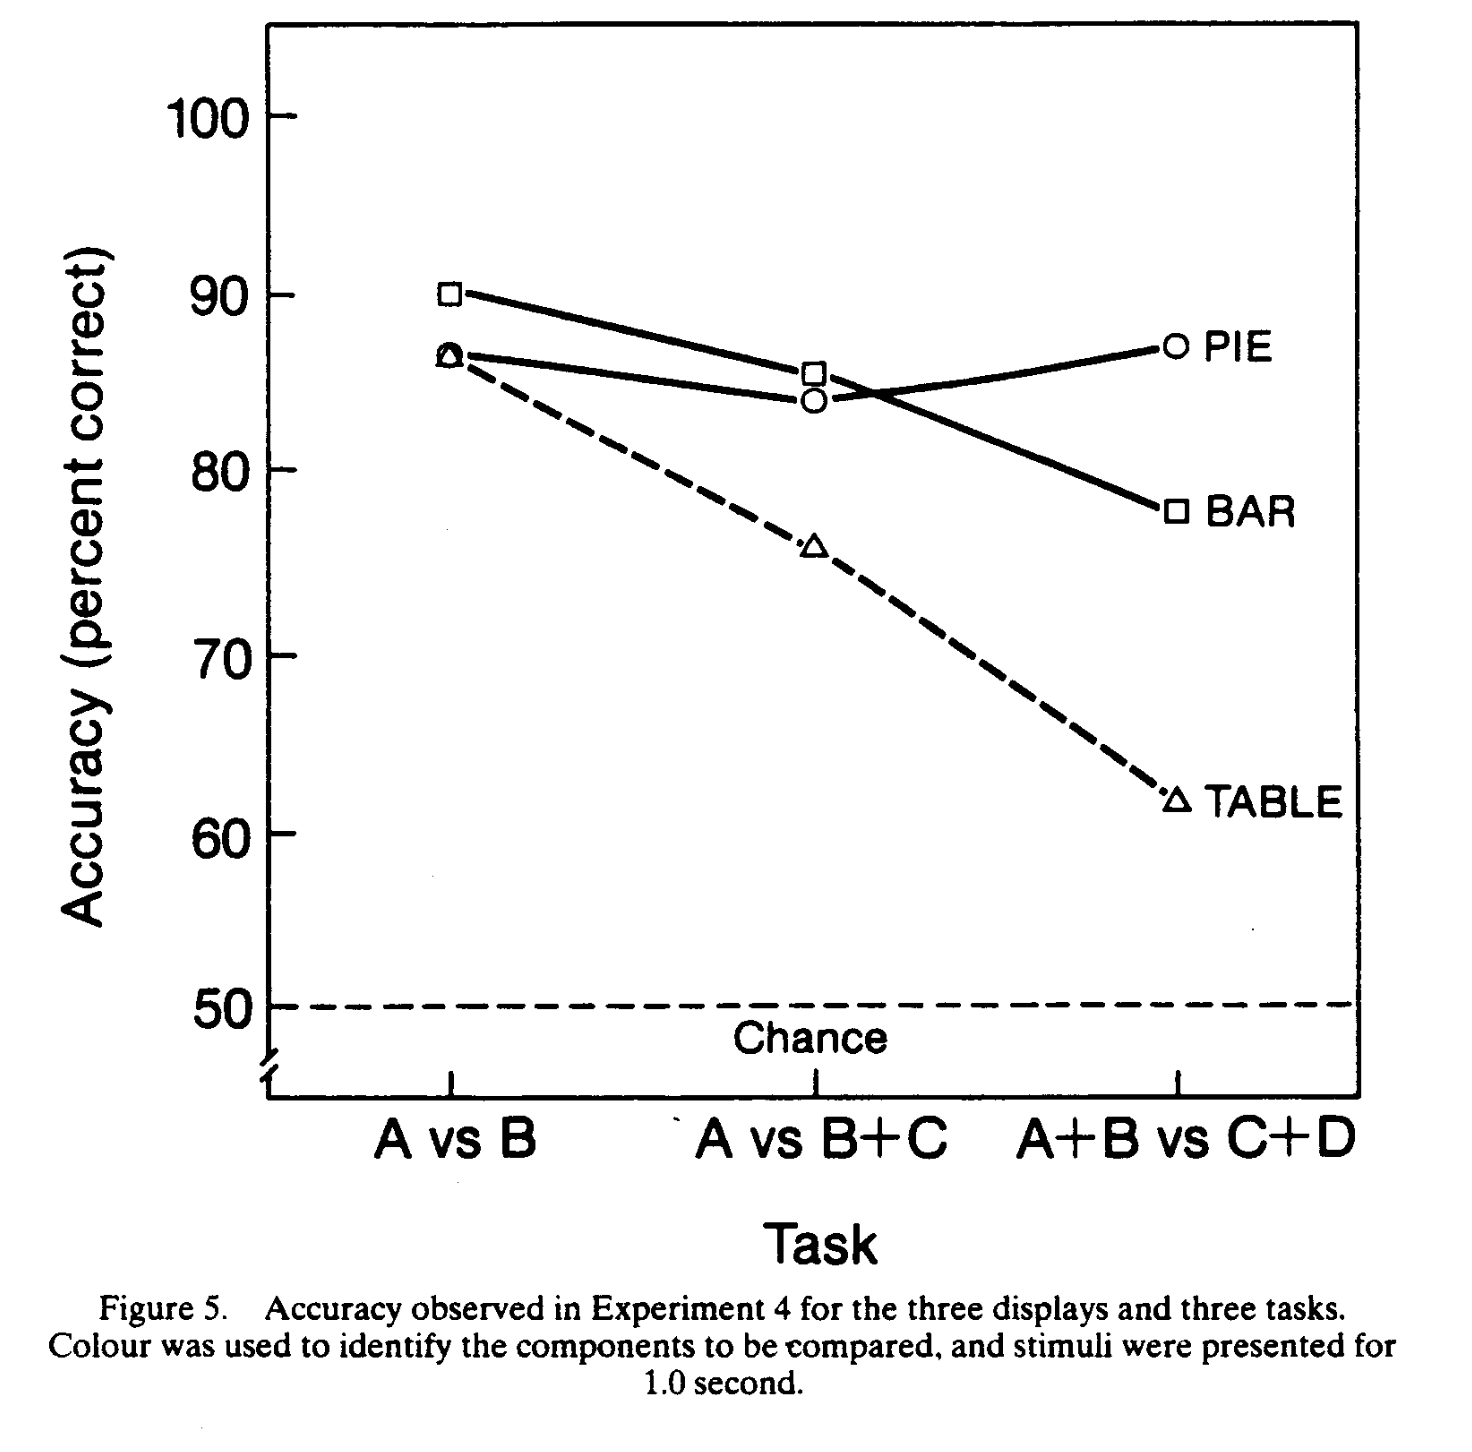
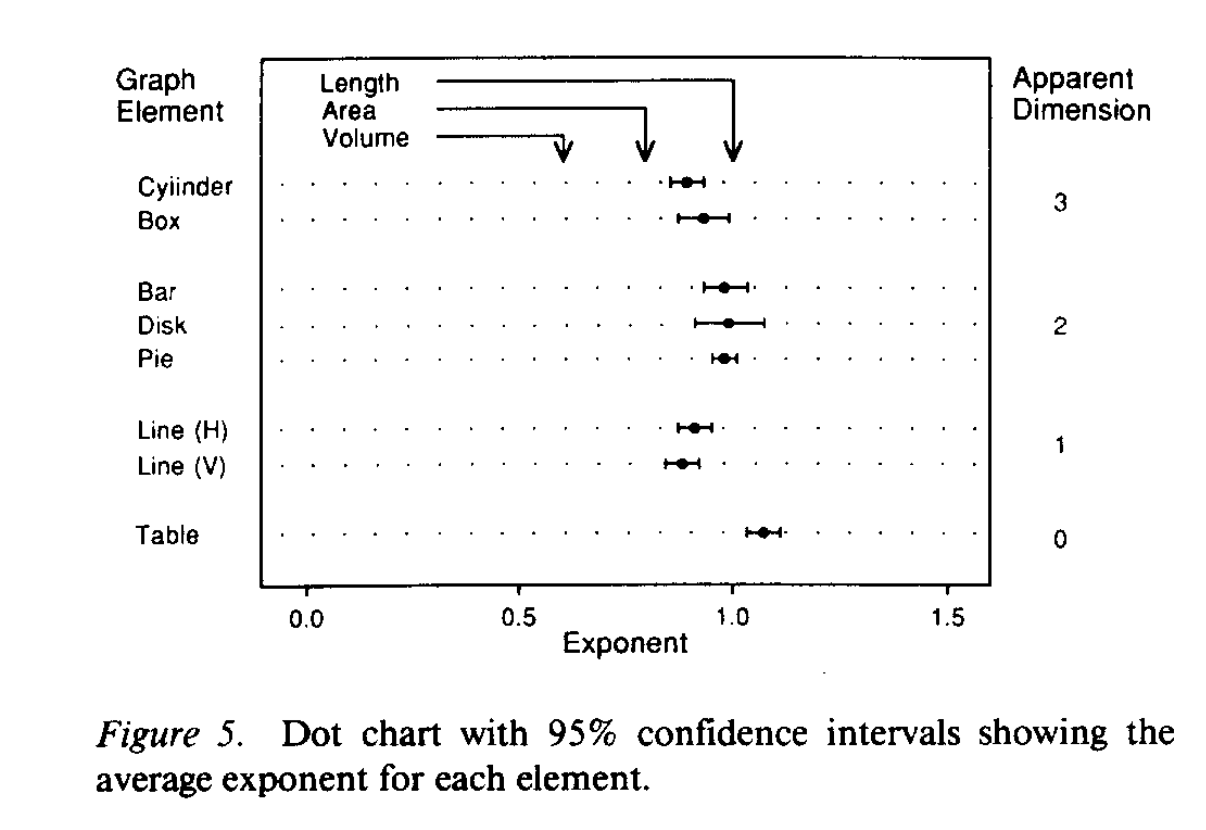
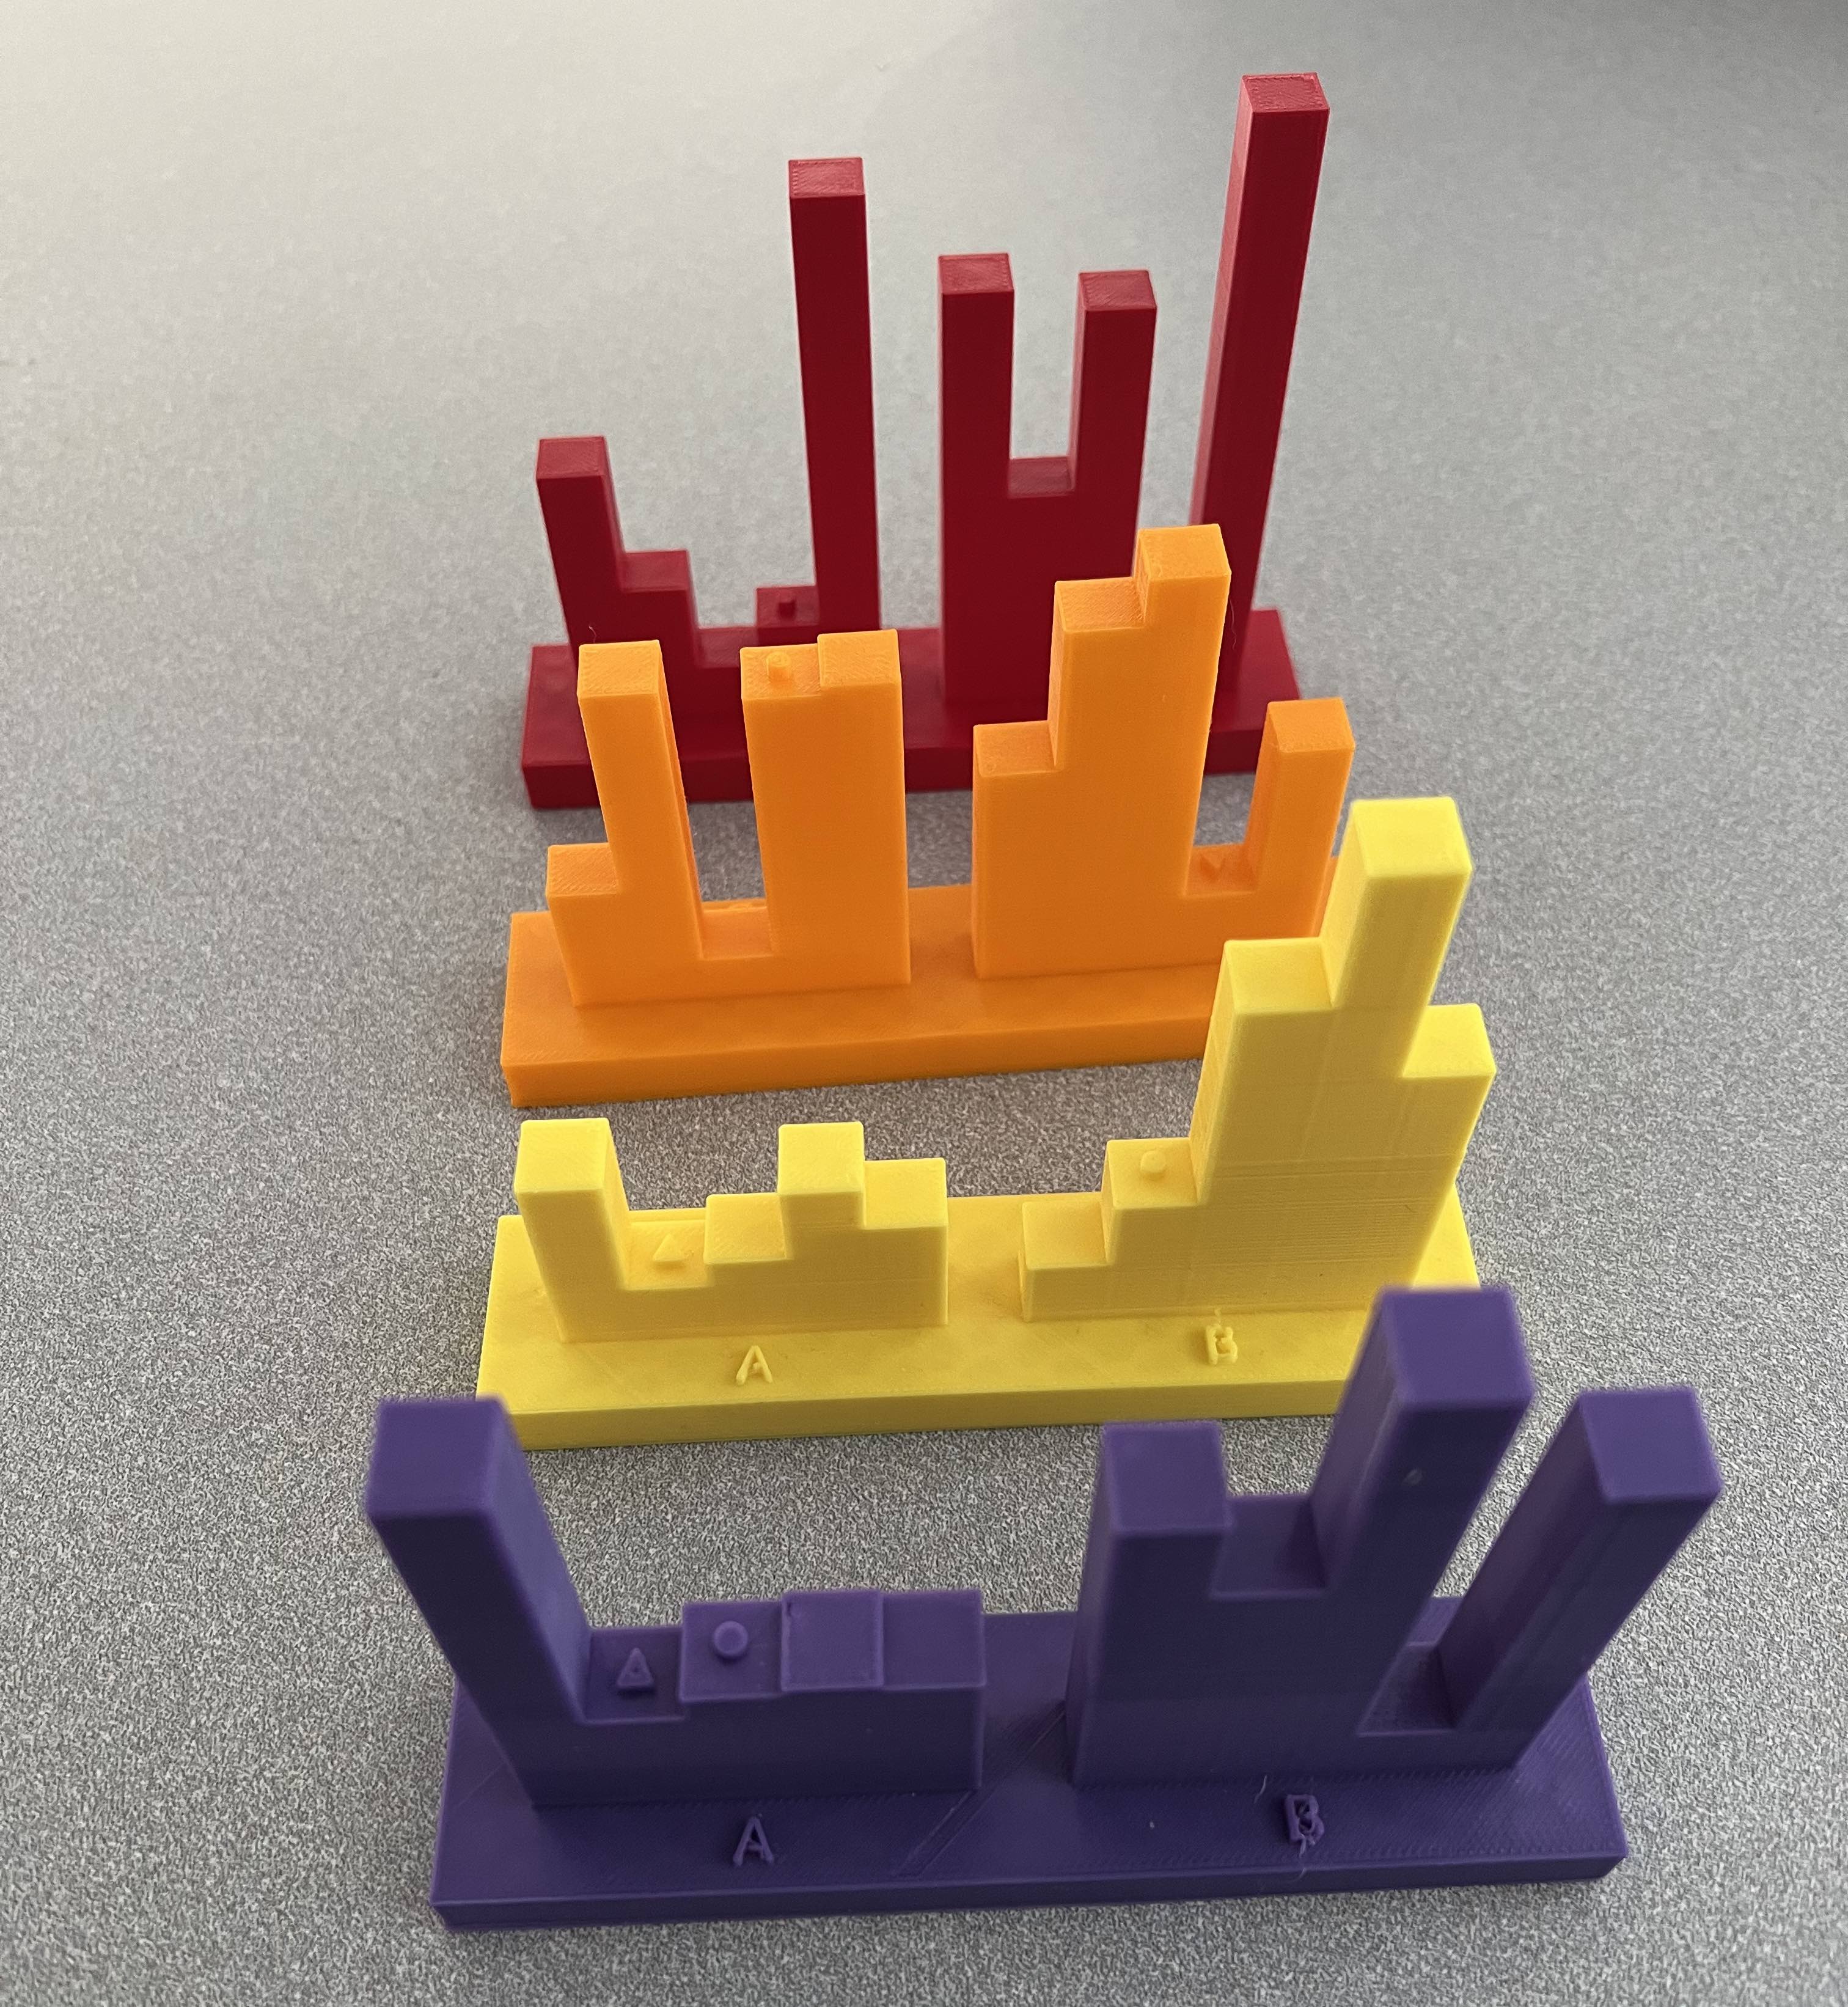
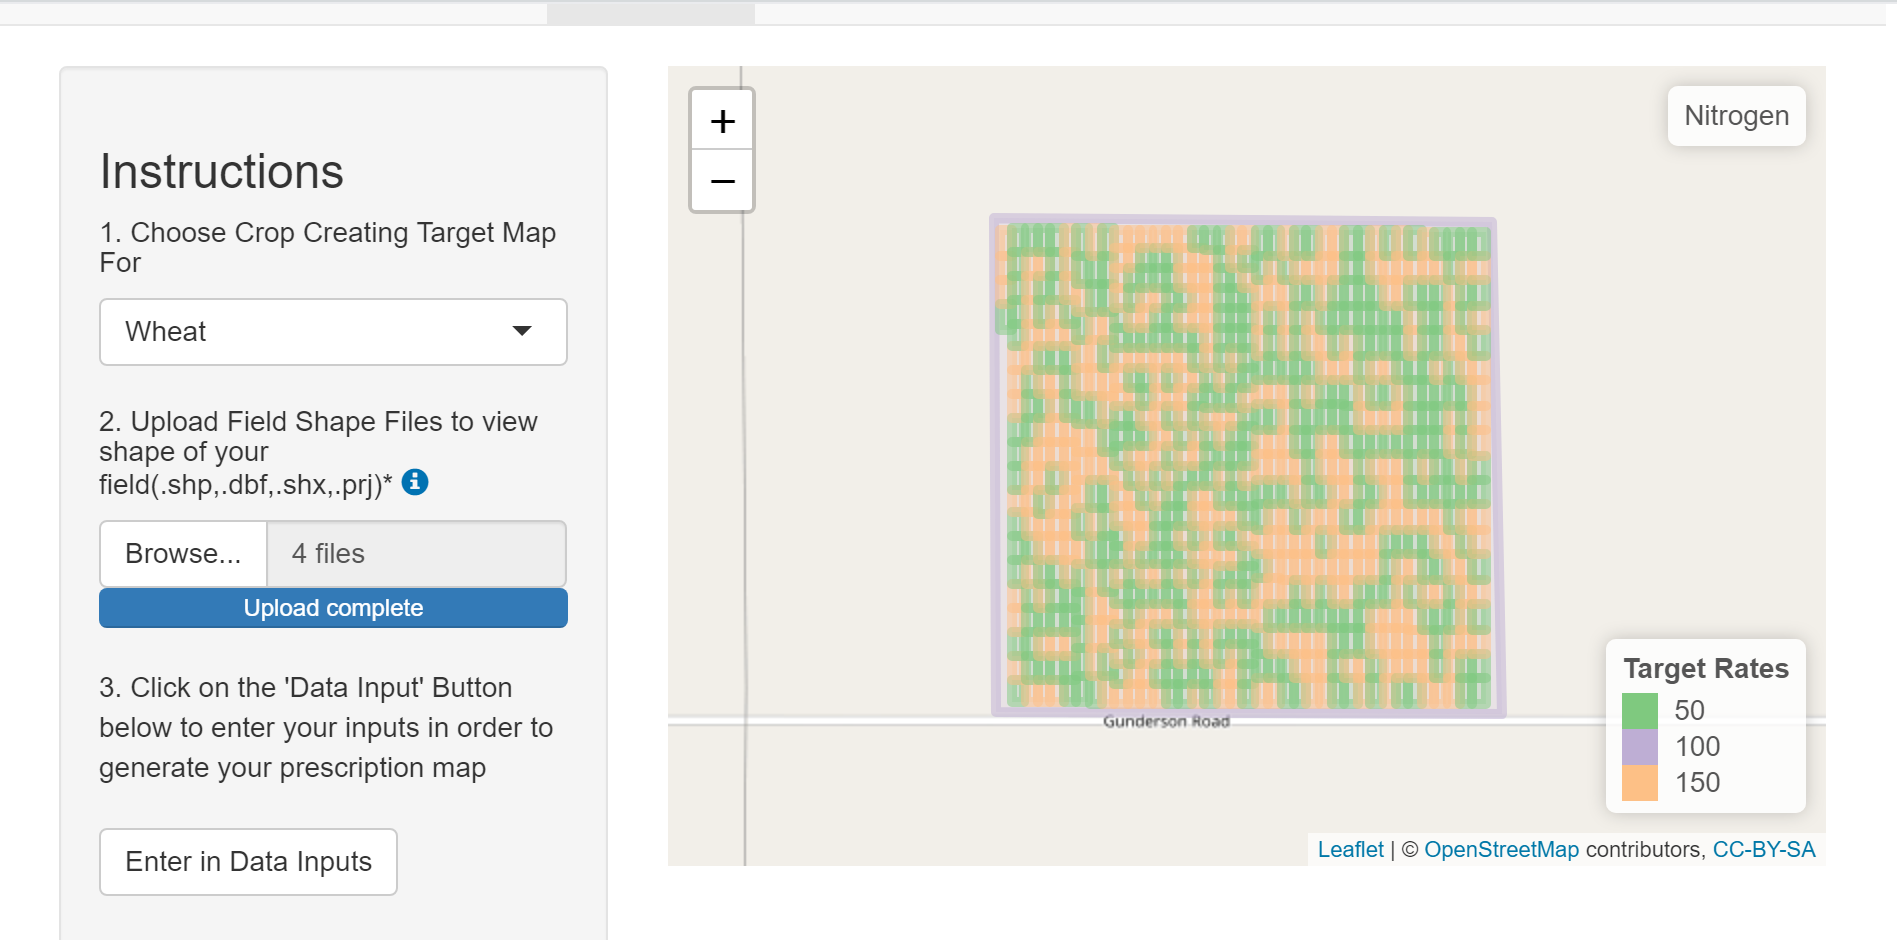
A shiny Model Buildr for Psychophysics Data
psycho-metrics
shiny
model fitting
user experiment
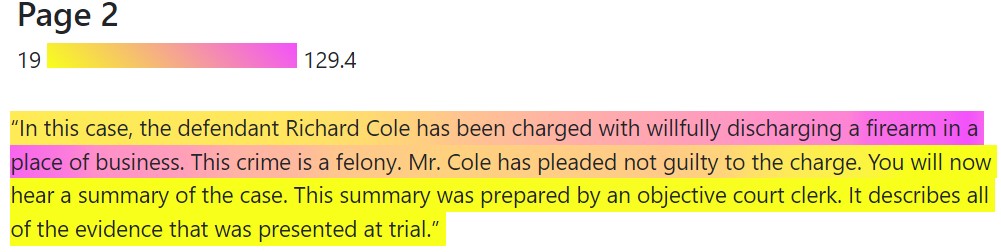
Jury Perception of Bullet Matching Algorithms and Demonstrative Evidence
forensics
user experiment
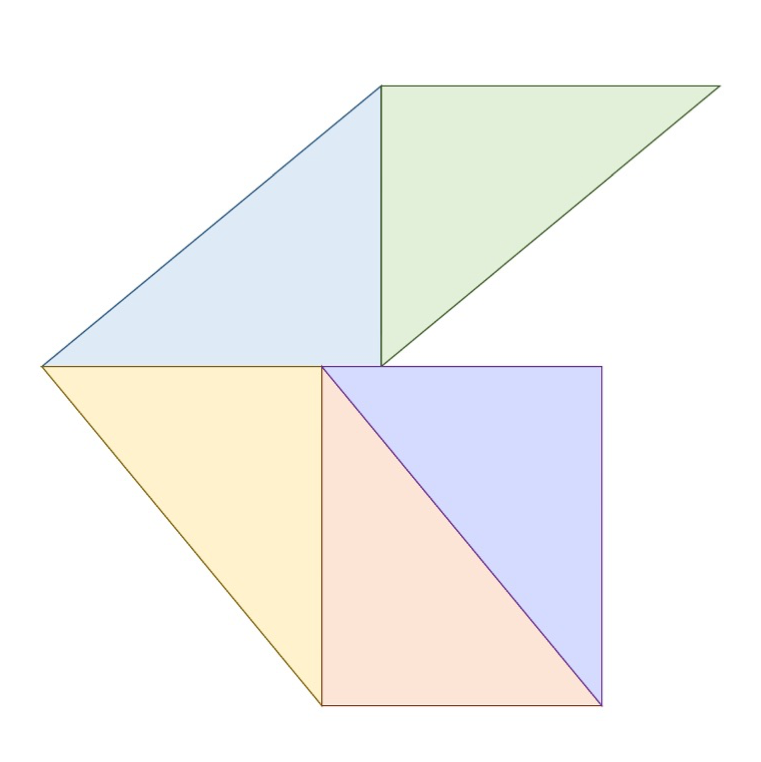
Quantifying Writer Variance Through Rainbow Triangle Graph Decomposition of the Common Word ‘the’
Shiny app
graphics design


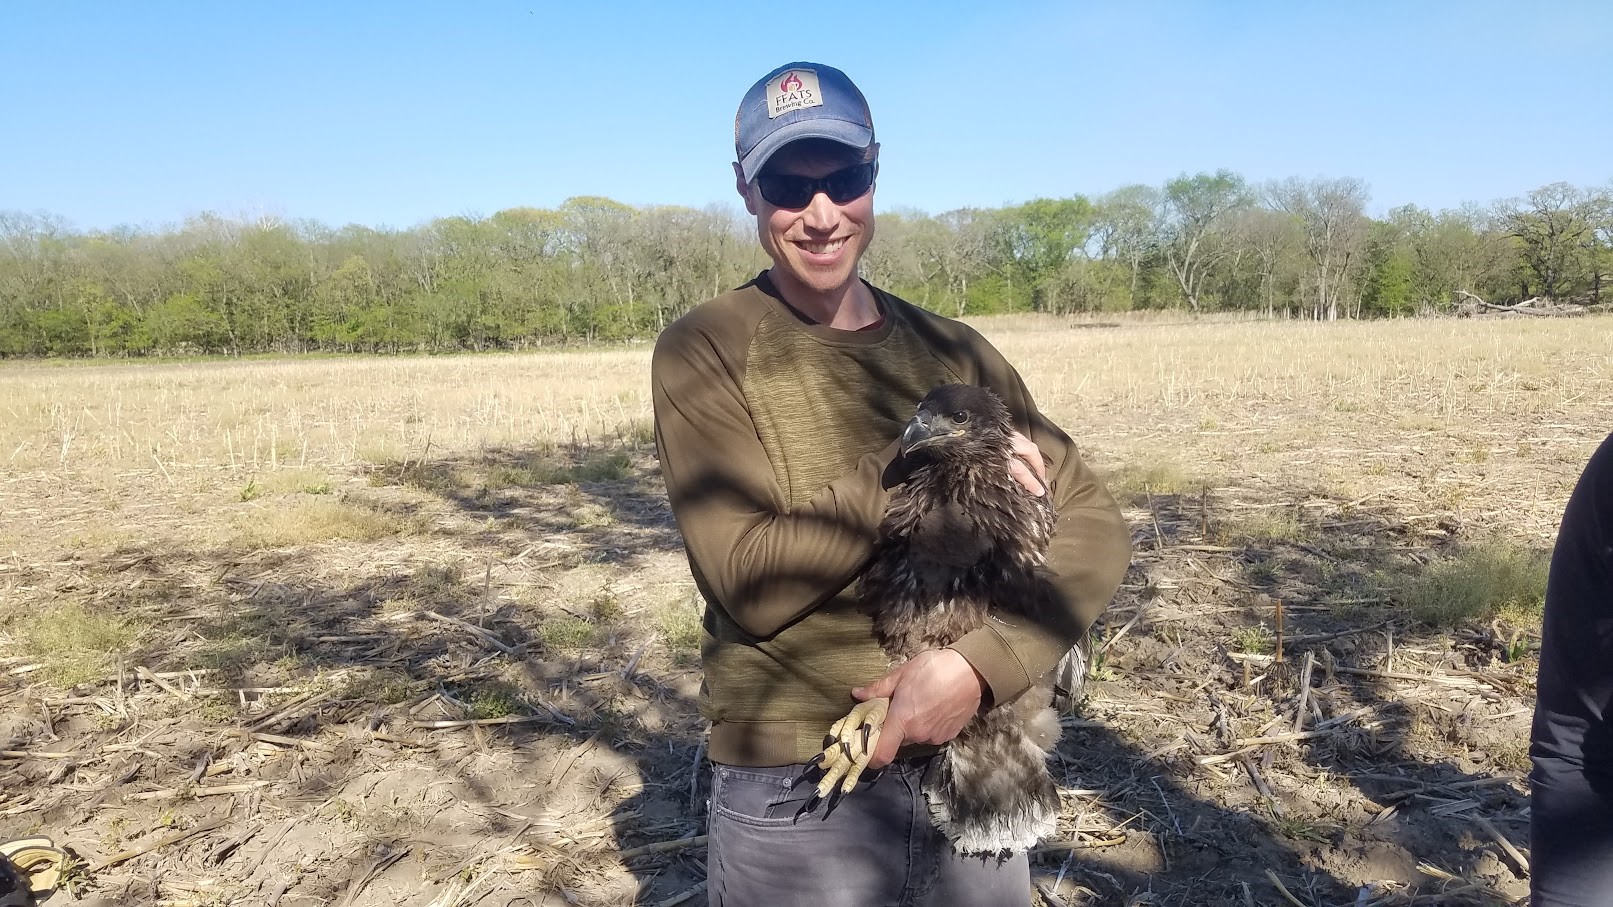
Applying unsupervised and supervised learning methods to minimize risk to bald eagles from industrial wind turbines
Machine Learning
collaboration
spatial
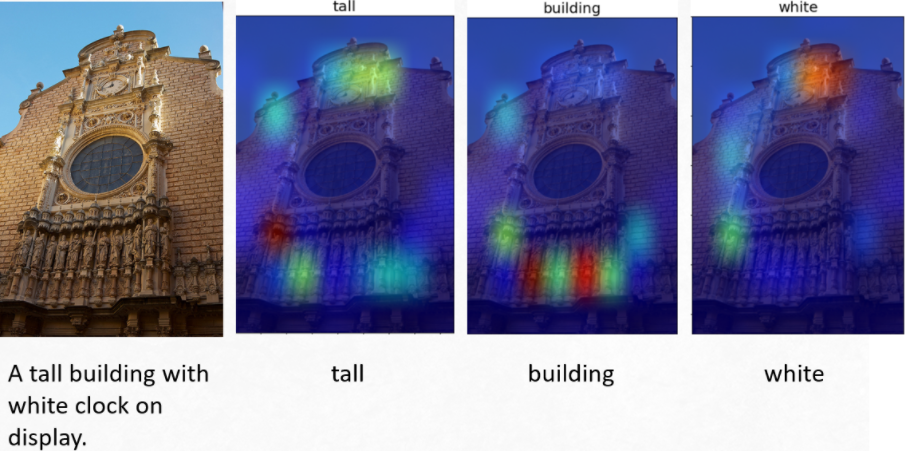
Automatic Image Captioning using Convolutional and Recurrent Neural Networks
Machine Learning
convolutional neural network
image processing
text analysis
python
Intergalactic Time Travel: Estimation Pilot Study
visual inference
interactive graphics
User experiment
No matching items